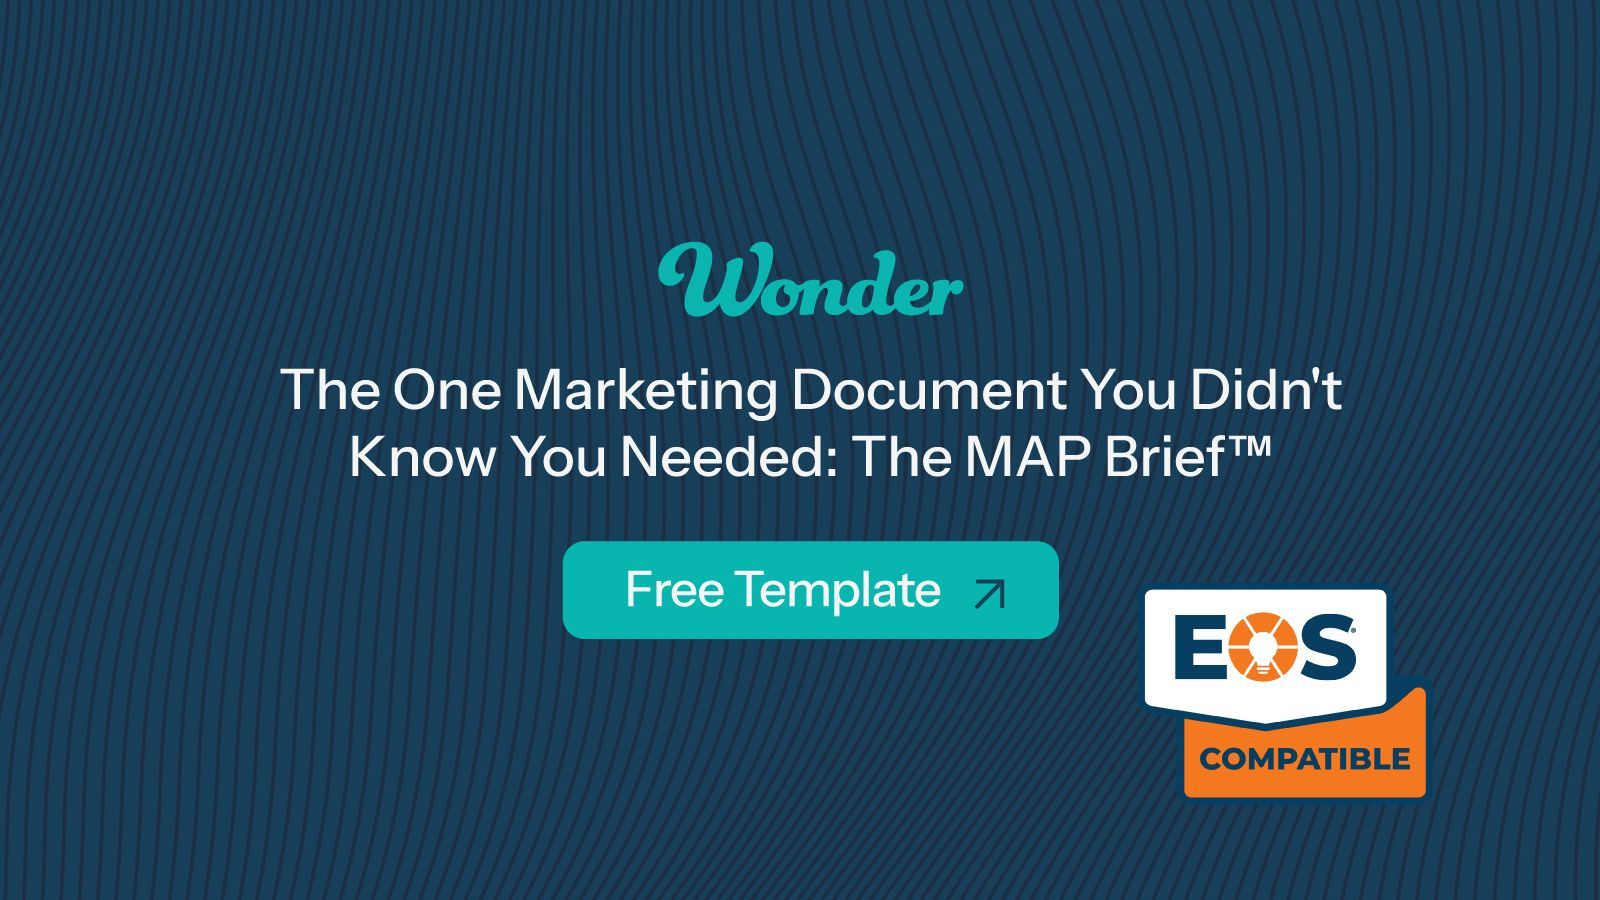
More than a decade ago, I was serving as Vice President of Sales and Marketing for a growing company. We were preparing for annual planning, and like most organizations, we had a long list of things we wanted to accomplish. Before the planning process started, I asked the CEO for thirty minutes. I told him I had one question. "If we jump forward a year and this plan absolutely crushed it, how would we know?" Then I waited. What followed changed the way I think about planning. He didn't start talking about marketing. He didn't mention trade shows, campaigns, advertising, websites, or lead generation. Instead, he described what success would look like for the business. Revenue growth. New opportunities. Strategic wins. The kinds of outcomes that would make us all look back and say, "That was a great year." It was a simple conversation, but it revealed something important. Most planning starts with activity when it should start with outcomes. We spend a lot of time talking about what we're going to do before we've fully aligned on what we're trying to accomplish. That idea stayed with me for years. Later, when I discovered EOS, it immediately clicked. The 3-Year Picture, the 1-Year Plan, and quarterly Rocks all start with the same principle. Define the future first. Then work backward to determine what needs to happen next. Over time, that thinking evolved into what we now call the MAP Brief™. The MAP Brief™ is a simple tool we use with every client at Wonder. It helps leadership, sales, and marketing align around a shared vision of success before we ever start talking about campaigns or tactics. The first page captures the big picture. Where are we today? What does success look like three years from now? What needs to happen this year? What are the key strategies that will get us there? The second page translates those strategies into quarterly priorities. This is where strategy becomes activation. Instead of creating a long list of marketing activities, we identify the Rocks that matter most over the next 90 days and build momentum one quarter at a time. Like the EOS V/TO, what I love most about the MAP Brief™ is its simplicity. It's not a hundred-page strategic plan. It's not a complicated marketing framework. It's a conversation tool that helps everyone stay aligned around the same goals. We use it internally. We use it with clients. We revisit it regularly whenever priorities shift or new opportunities emerge. Most importantly, it helps answer a question that every leadership team should be asking: What has to be true for this year to be considered a success? Everything else becomes much easier once that answer is clear. We've made our MAP Brief™ template available as a free download. If you're looking for a simple way to align leadership, sales, and marketing around your annual objectives, I hope you'll give it a try. Download the Free MAP Brief™ Template Use it. Make it your own. We hope it helps your team create the same kind of alignment it has created for ours and for the clients we serve.
Greenville, S.C.-based agency becomes an approved strategic partner of EOS Worldwide, giving companies running on EOS access to a marketing partner fully aligned with their operating system